Professor Andrew Hall is leading an effort to improve the mapping of the Murray-Darling wetlands to inform water management planning and maximise the ecological benefits from limited environmental water flows.
The Murray-Darling Basin is the drainage basin for six of Australia’s longest rivers and covers most of New South Wales and Victoria. The Basin has seen the construction of many dams and weirs, with extensive regulation, diversion and extraction of water supporting irrigated agriculture across the region. Most water going downstream has a recognised owner and an allocated purpose, and there is only significant ‘surplus’ water during major flood events.
The loss of dynamic and seasonal water flows, and periodic disconnection of tributaries, pools and lowland floodplains has had consequences for the natural environment. In particular, the internationally significant wetland complexes and floodplains of the Murray-Darling Basin, a range of productive freshwater ecosystems with high biodiversity, which were previously supported by seasonally varying water levels and intermittent inundation, have been particularly degraded by limited water flows.
A Basin Plan is now in place to manage water resources in the national interest, which includes improving ecological conditions and protecting habitats. In New South Wales, the state government has a central role in managing environmental water through water sharing plans and held environmental water. Alongside this, the Commonwealth Environmental Water Holder (CEWH), as the single largest ‘owner’ of water in the Basin, works with NSW agencies to deliver ‘environmental flows’ to sustain freshwater ecosystems along the Murray-Darling Basin.
Given that the ‘environmental water’ available is quite a small amount compared to what used to flow through the Basin unimpeded by weirs and irrigated agriculture, strategic decisions need to be made as to where, when and how much environmental water should flow for maximum benefit, to restore aspects of natural conditions particularly to support threatened ecological systems and species. The decisions are complicated by the fact that different amounts of environmental water are available every year, due to normal climate variability. Water flow priorities will change from ‘dry years’ to ‘wet years’ or, for example, if uncommon rainfall events happen across wetland areas. Water planning strategies have to be dynamic and flexible to make the best use of the water available under the prevailing conditions.
Planning environmental water flows for wetlands and floodplain areas is even more problematic because these water bodies are intermittent or ephemeral at the best of times. To understand how much environmental water is needed to inundate an area or create flows between connected wetlands, the locations, sizes and volumes of hundreds of interconnected wetland depressions must be known. Until recently, detailed maps with this information were not available.
Professor Andrew Hall, a Senior Principal Gulbali Research Fellow in Geospatial Science at Charles Sturt University, is leading an effort to improve the mapping of the Murray-Darling wetlands. This is providing the ‘where’, ‘how much’ and ‘how connected’ information needed about filling wetlands to inform water management planning to maximise the ecological benefits from limited environmental water flows.
“Ironically, we can do this work effectively because the entire area suffered a severe multi-year drought and by 2008, the wetlands and floodplains of the Murray-Darling Basin were very dry,” admits Professor Hall. In 2008, the NSW government undertook a very thorough LiDAR (Light Detection and Ranging) mission, to create a digital map of the terrain. LiDAR is a remote sensing technology that emits pulses of laser light and measures the time it takes for the pulses to reflect back to a sensor, calculating the distance to the target. Mounted on an aircraft or a drone, a LiDAR system can do aerial surveys of large areas of terrain, generating a 3D point cloud of the surface to create an accurate digital terrain map. While it can penetrate vegetation to reflect back from the underlying ground surface, conventional LiDAR can’t penetrate water. “So, the LiDAR data gave us the accurate topography of the wetlands, to a 1 metre resolution, including in areas where water would normally be there,” explains Professor Hall.
Research areas: geospatial science, water management, biodiversity conservation
Research problem: high-precision mapping of ephemeral and intermittent water bodies rapidly at scale to determine extents, volumes and water levels to connected sources
Collaborators:
Outcomes: High-quality maps of floodplain wetlands with information on spatial extents, volumes and source connectivity to inform multi-year environmental water flow strategies for high-priority wetland ecologies across the Murray-Darling Basin
Impact: improved health of high-value and endangered freshwater wetland ecosystems across the Murray-Darling Basin
Beneficiaries: the natural environment, while still enabling water access for other users across the Basin
With high-resolution digital maps of the wetlands already available, identifying each wetland’s inundation boundaries – the surface area when ‘full’ – and the volume of water required to fill it may seem straightforward. But seeing as wetland filling is intermittent and variable, the natural inundation extent or fill boundary of a wetland is often unclear, unlike for permanent waterways like rivers. On-ground survey methods are usually required to identify changes in vegetation and soil that demonstrate the areas regularly inundated with water. It’s a method that doesn’t lend itself to mapping large areas with high precision to calculate water volumes.
Professor Hall’s team instead relied on the existing 3D digital terrain model, and an application of high school calculus. Their method relies on the idea that immediately after rising water in a wetland reaches a threshold ‘full’ level, much larger volumes of water are needed to raise the water level even further, not only inundating an isolated wetland, but also flooding the surrounding local area. That threshold can then be considered the wetland fill level.
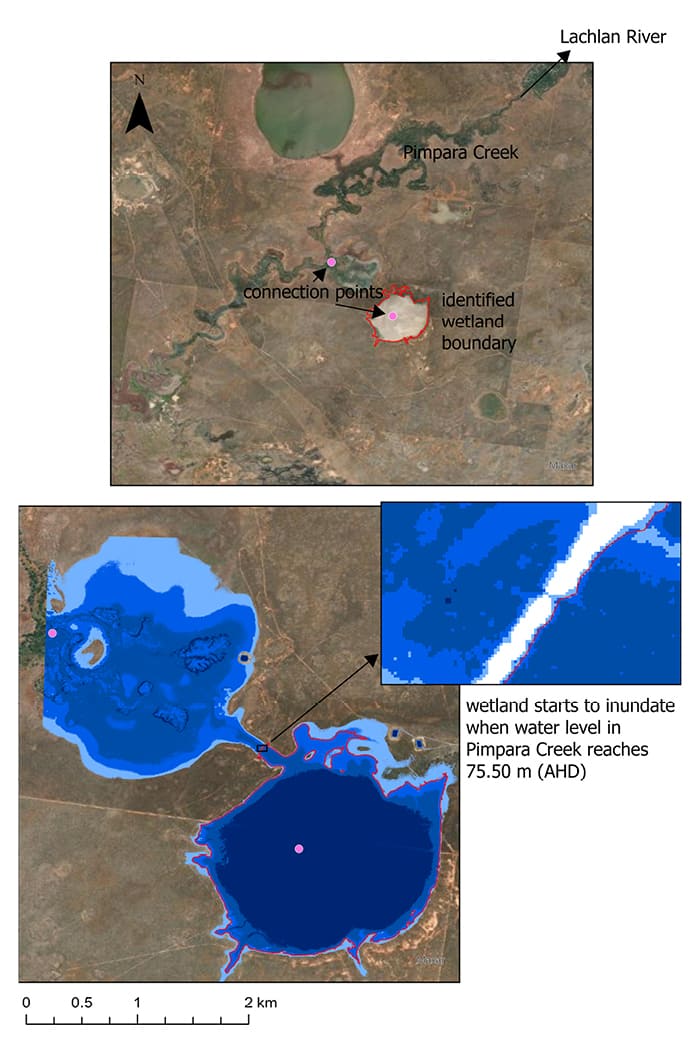
“For each wetland on our terrain model, we defined a boundary around the wetland and surrounding low-lying elevations, and identified the lowest point in the terrain,” explains Professor Hall. “Then we wrote a computer program that simulated filling the depression with water. At 1 cm intervals up from the lowest level, we’d compute the water volume and water surface boundary, based on the geometry of the 3D terrain model. We were effectively calculating wetland volume as a function of water depth, and then looking for the point where there was the greatest change in volume, for only a minimal increase in depth. This identified the transition from wetland inundation to flooding of the broader surrounding area.”
In this way, large areas of floodplain and wetlands could be mapped to delineate hundreds of wetland boundaries and their water volumes, in a semi-automated and repeatable way.
The next step was to check their maps against real-world information. By overlaying their calculated wetland fill boundaries against high-resolution satellite imagery of the areas, the boundary could be compared against visual patterns of terrain, changes in vegetation and any standing water, at multiple points in time when the satellite images were acquired. Professor Hall notes that “Trees were often a very good indicator of a wetland boundary. In semi-arid regions, they grow nearby because they’ve got access to ground water that flows from the wetland, but they don’t grow in areas that are regularly inundated, because the saplings drown. So, a line of trees matching our calculated boundary could really validate our method.”
Once the wetland areas and volumes were established, Professor Hall’s team went one step further, identifying the channels where water would flow from to fill each wetland. “We’d enlarge the boundary around our wetland map to also encompass the source water channel, and identify a low point in that channel closest to the wetland, and the lowest point in the wetland itself. Then we’d run the calculation again, simulating filling both the wetland and the channel area with water, and see at what water elevation the two bodies of water would connect into one larger one. That gave us the level the water in the channel would need to rise to, and by extension the volume of water required in the source water body feeding that channel, to start filling the receiving wetland.”
“In wetlands and floodplains where there is no water infrastructure, no weirs and pumps, knowing the elevation levels of all of the source water channels is just as important as knowing the boundaries and volumes of the receiving wetlands. If you can’t pump the water around, you have to manage the flows so water sources rise to an appropriate elevation so they can then fill the lower wetlands.”
 This mapping technique was developed specifically for wetland depressions associated with the lower reaches of the Murrumbidgee River in the southern Murray-Darling Basin, and it has now been applied to many ephemeral or intermittent wetlands across the Basin. The mapping in the region is ongoing, steadily providing information on wetland areas identified as a priority for high-value or endangered ecosystems and species.
Professor Hall summarises: “We’ve now got a really good inventory that tells you exactly where each wetland is, how big it is, what depth it will be, how much water is required to fill it and what level the nearby river or body of environmental water needs to get to in order for an overflow to create a connection to the wetland. In all of the areas where that information was needed to plan environmental flows for each season. It all feeds into the Long-Term Water Plans the NSW Department of Climate Change, Energy, the Environment and Water updates to make much more targeted and efficient use of the limited environmental water in the Murray-Darling Basin.”
And they provided all of this information with existing data, and clever use of computing and calculus. It’s a great return on research investment for the environment.
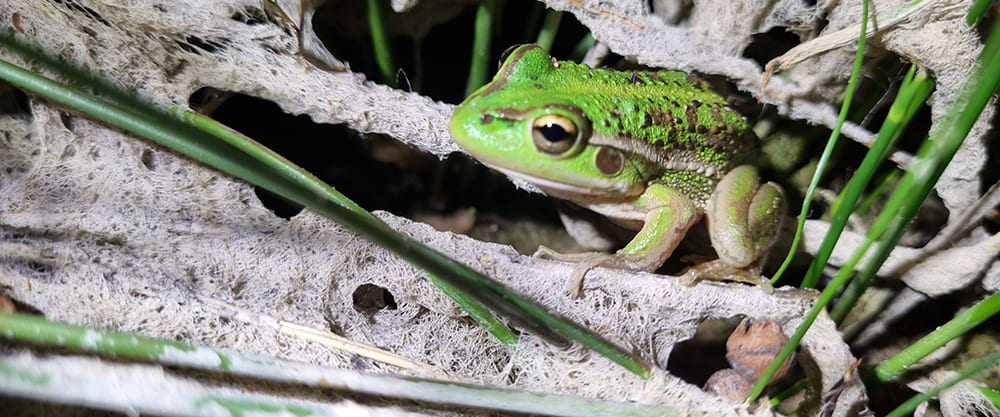
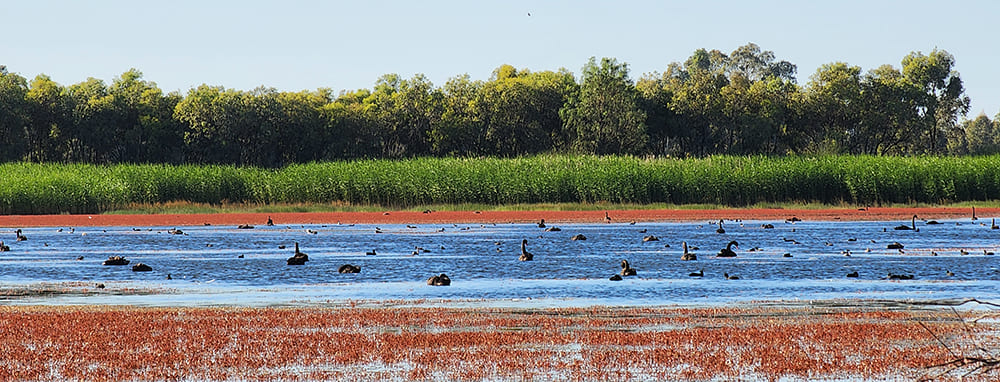
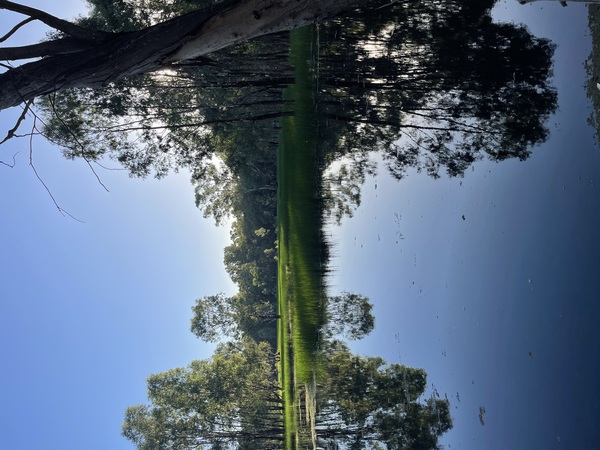
Image credits: Southern Bell Frog by Audrey Beard; Cherax Swamp Swans by Emmalie Sanders; Steam Engine Wetland by Fleur Stelling